Take the Guesswork Out of Understanding Your Market Position
B2B exhibition organizers, do you understand how your event is performing compared to your competitive peer set? Performance is an integral metric in strategic planning and it reveals your event’s strengths and weaknesses. It helps direct strategic planning to where it counts, where improvements are needed and where to build on an event’s success.
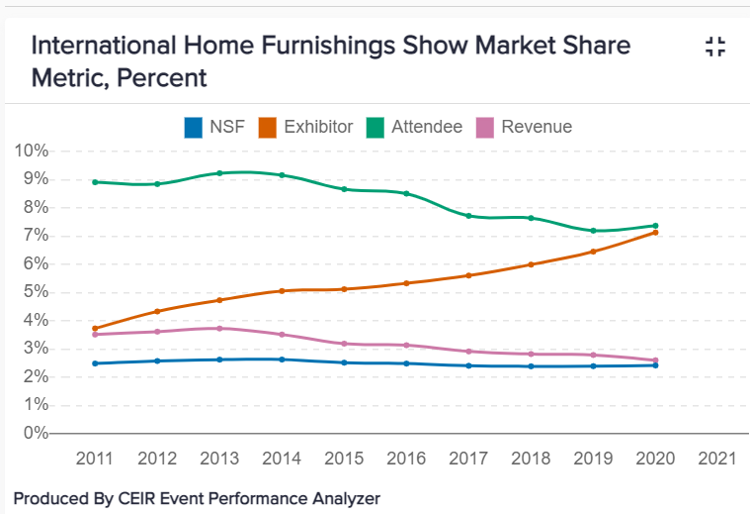
The Event Analyzer Tool looks at your event’s performance for critical metrics:
Number of attendees
Number of exhibitors
NSF of paid space
Organizer revenues
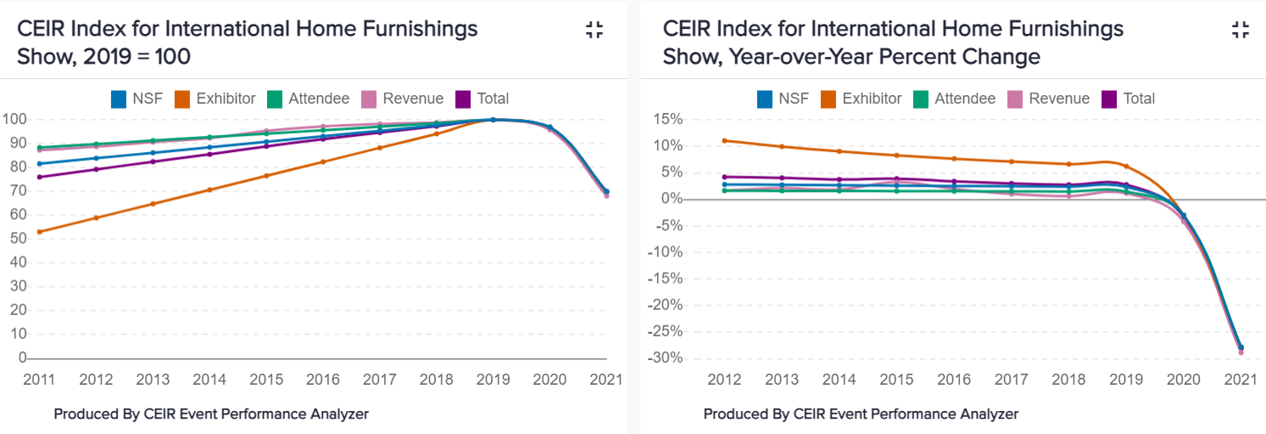
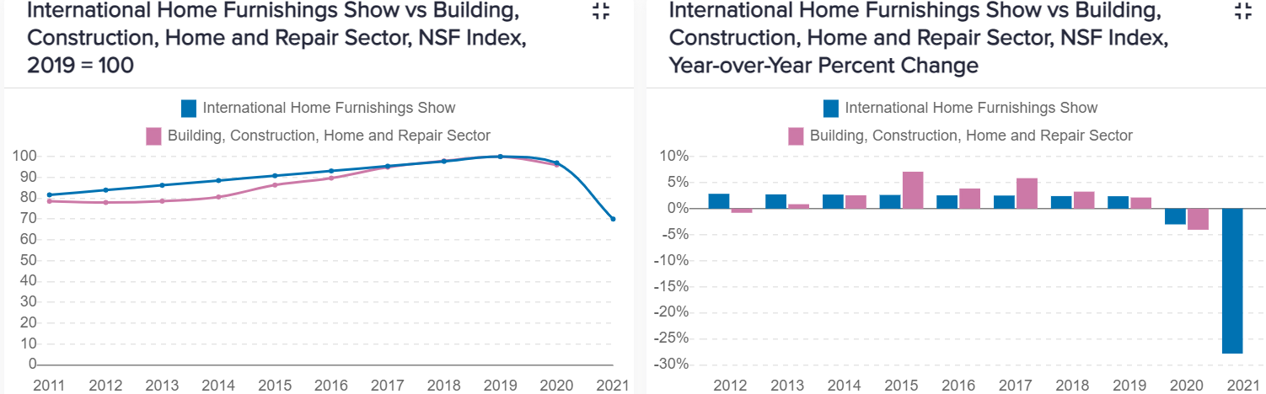
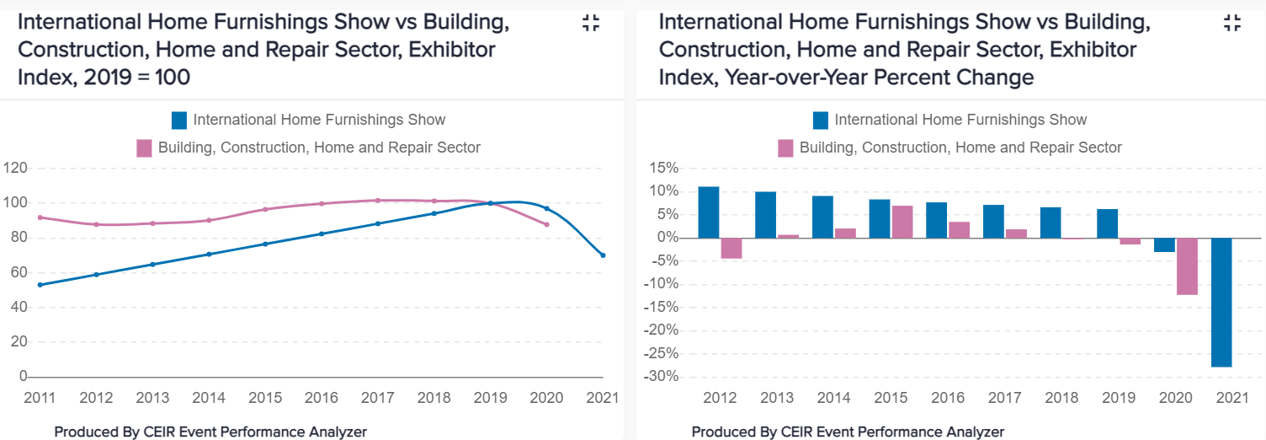
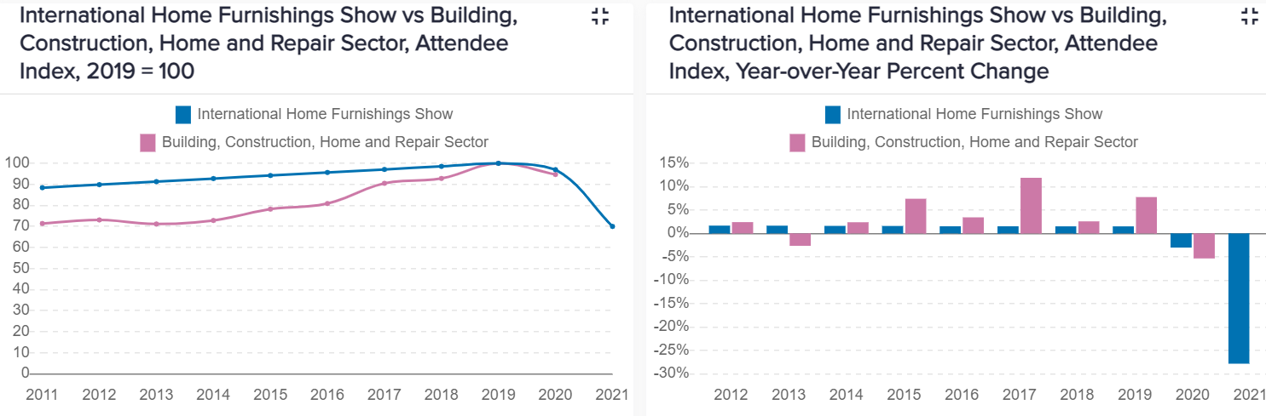
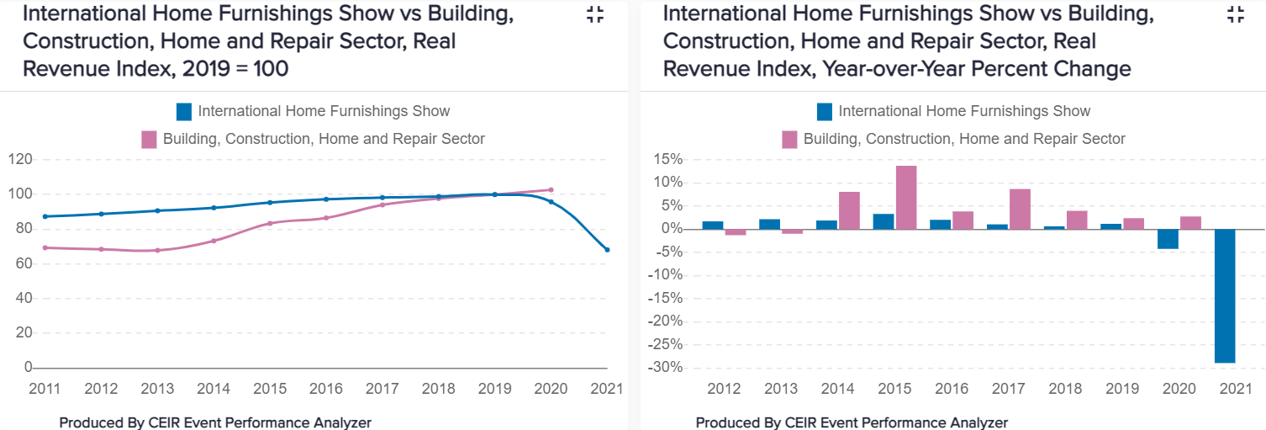
The beauty of this tool is that it visualizes your event’s performance in 13 charts (see sample of charts below), to prior editions of your event and the corresponding CEIR Sector Index aka your competitive peer set.
Benefits of using the Event Performance Analyzer
Quickly see if your event is outperforming, under-performing or is in line with other events in your industry sector.
The tool generates charts that you may share with your show team or add into a presentation. Results will quickly point to areas that need to be addressed when planning for the next edition of your event. It may also give you bragging rights to share with your board, where you’re outperforming the competition or maybe even use in your event promotions.
Users simply add results for the next show year when it occurs. The CEIR Index model is updated annually in the Spring.
Users have FREE ACCESS to 13 charts. The data is downloadable into an excel file and/or users may download charts as a pdf, png or jpg.
Sharpen your strategic planning approach – don’t wait, start now!